Understanding Our Air

Air quality data helps us understand what we are breathing every day. This page breaks down what we measure, what it means, and when to take action.

Air Quality Index Scale

Main Indicator

Air Quality Index (AQI)

The AQI turns complex pollution data into a simple number and colour. The higher the number, the greater the risk to your health.

Good

  • AQI 0 – 50

Air is clean and fresh. Safe for all activities.

Moderate

  • AQI 51 – 100

Acceptable air quality. Unusually sensitive people may experience minor effects.

Unhealthy (Sensitive)

  • AQI 101 – 150

Children, elderly and people with heart or lung disease should reduce outdoor activity.

Unhealthy

  • AQI 151 – 200

Everyone may begin to experience health effects. Sensitive groups at serious risk.

Very Unhealthy / Hazardous

  • AQI 201+

Serious health risk for the entire population. Emergency conditions possible.

Know What To Do

Good Day vs Bad Day Guide

So what does this mean for me today? Use this guide to understand what action to take.

Good Air Day

  • Safe to exercise and be active outdoors

  • Children can play outside freely

  • Elderly are safe for normal activity

  • Enjoy your usual outdoor activities

Moderate / Risk Day

  • Limit long outdoor exposure
  • Sensitive groups take caution
  • People with asthma carry relief inhaler
  • Reduce strenuous physical activity

Bad Air Day

  • Avoid all outdoor physical activity
  • Keep windows and doors closed
  • Wear a mask if you must go outside
  • Keep children away from busy roads
  • People with lung or heart disease: stay indoors

What We Measure

Pollutants Explained Simply

You cannot see most of these — but they affect how you breathe every single day.

PM2.5

Fine Particles
Tiny invisible particles so small they go deep into your lungs and bloodstream. The single biggest health risk in our air.

  • Vehicles, burning waste, coal, industry

PM10

Coarse Dust Particles
Larger dust particles still small enough to enter your airways. Especially harmful for breathing and those with asthma.

  • Dust, construction, unpaved roads

NO₂

Nitrogen Dioxide
A gas released by cars and burning fuels. Very common near busy roads and highways. Irritates the lungs and airways.

  • Cars, traffic, burning fuels

O₃

Ground-Level Ozone
Not the protective ozone up high – this ozone forms at ground level in sunlight and hot weather. Harmful to lungs.

  • Forms from sunlight + pollutants

SO₂

Sulfur Dioxide
Released from burning coal and industrial processes. Can cause breathing problems and worsen asthma even at low levels.

  • Power stations, coal, factories

CO

Carbon Monoxide
A colourless, odourless gas produced by incomplete burning – especially dangerous indoors with poor ventilation.

  • Indoor fires, coal stoves, vehicles

Vulnerability

Who Is Most at Risk?

Children

Airways still developing. Breathe faster than adults, taking in more pollutants relative to body size.

Elderly People

Weakened immune and respiratory systems make recovery from pollution-related illness much harder.

Pregnant Women

Pollution crosses into the womb – affecting the unborn baby’s development and birth weight.

Asthma & Lung Disease

Any elevation in pollution can trigger attacks or rapid deterioration of existing lung conditions.

Near Busy Roads

Residents within 150m of heavy traffic face elevated NO₂ and PM2.5 exposure daily.

Near Factories & Waste Sites

Communities like Kya Sands – 80,000+ residents exposed to toxic smoke from illegal burning.

Global Impact

Air Pollution Deaths – 2021 Global Estimates

Air pollution now kills more people than tobacco worldwide. Most of these deaths are from human-made pollution.


Outdoor particulate matter
4.7 million
Household air pollution
3.1 million
Outdoor ozone pollution
0.5 million

Note: Natural sources of particulate matter also contribute — but the majority of these deaths result from human-made emissions.

Our Data

How We Track the Air

We use real-time air quality sensors across Johannesburg to monitor pollution levels in different communities.

  • 1

    Sensor Network Across Johannesburg
    Sensors are placed in communities and pollution hotspots – near busy roads, industrial areas, and residential zones – to capture real conditions where people live.

  • 2

    Real-Time & Hourly Data Updates
    Air quality readings update in real-time or hourly, so you always have the latest information about the air in your area.

  • 3

    Integrated with SAAQIS Platform
    Our data connects with the South African Air Quality Information System (SAAQIS) — the government’s official national monitoring platform — for verified, reliable measurements.
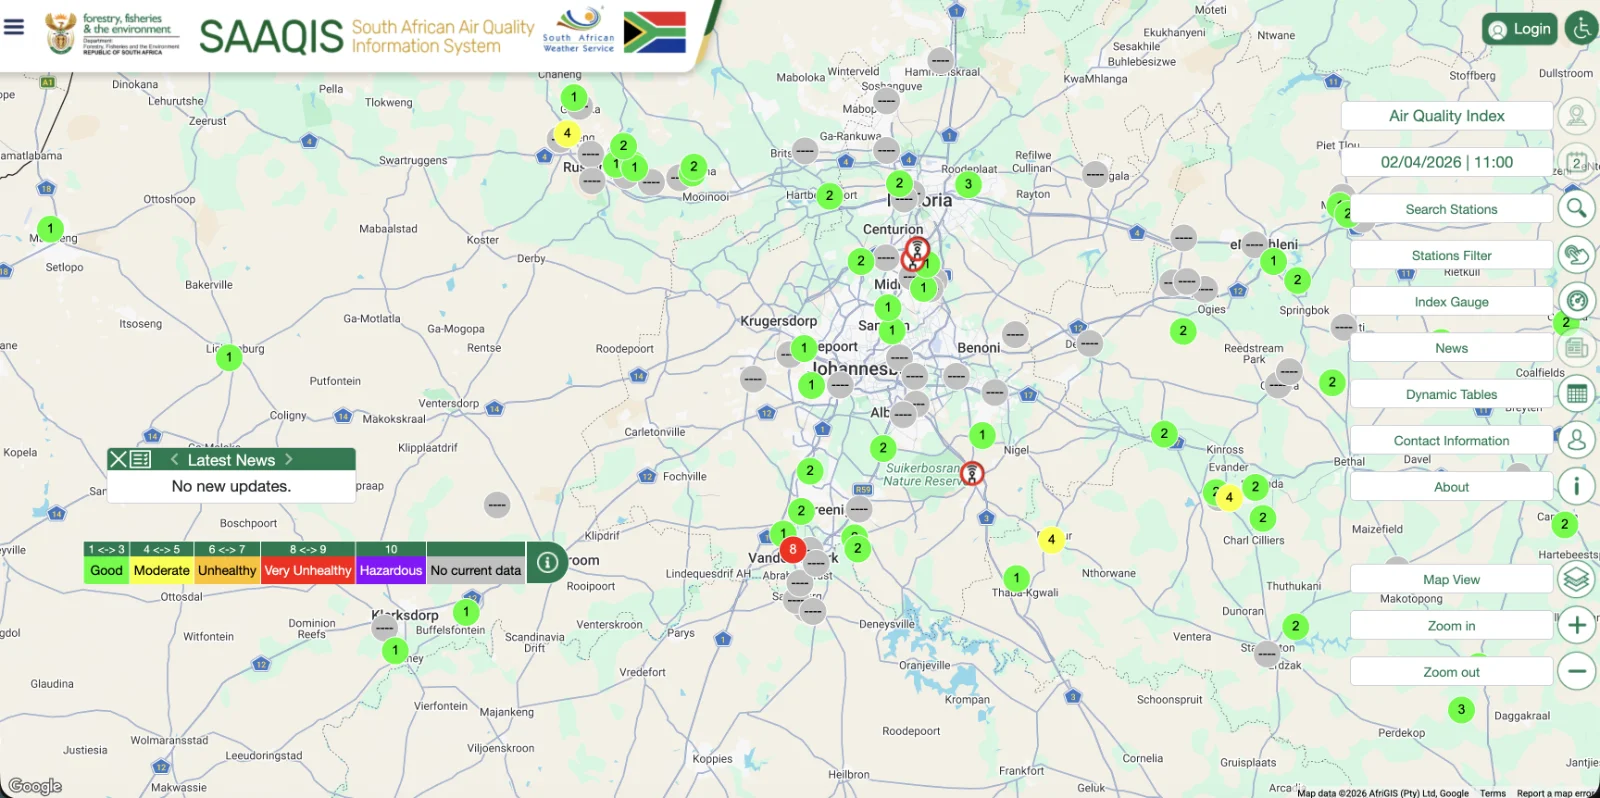
View the SAAQIS Live Map

See air quality readings at monitoring stations across South Africa in real-time.

South African Air Quality Map Information System
Live Dashboard Preview

Johannesburg

25

  • The air quality is generally acceptable for most individuals. However, sensitive groups may experience minor to moderate symptoms from long-term exposure.

PM2.5
25 μg/m³
SO₂
21 μg/m³
O₃
17 μg/m³
PM10
13 μg/m³

Updated: just now

Source: SAAQIS

Patterns & Trends

What We’re Seeing

Understanding when air is worse – and when it clears – helps you plan your day and protect your health.

When Air Is Worse

  • Morning traffic rush hours

  • Winter — cold, still air traps pollution close to the ground (very common in Gauteng)

  • Open burning of waste in communities

  • Hot, dry, sunny weather forms ozone

  • Construction and unpaved road dust

When Air Is Cleaner

  • Rainy days — rain washes away dust and smoke

  • Windy weather — spreads and dilutes pollution

  • Late night and early morning (low traffic)

  • Summer winds that carry pollution away

  • Areas with trees and green spaces

South Africa & Johannesburg specifically: During winter months, cold still air causes a phenomenon called temperature inversion – pollution gets trapped near the ground and cannot escape. This is why Gauteng and the Highveld region often have significantly worse air quality in June, July and August. Burning coal and wood for heating makes this worse.

0M
Premature deaths globally per year linked to air pollution
0%
Of low-income SA households rely on solid fuels like wood and coal
0k+
Residents affected by the Kya Sands landfill dumping & burning
0%
Of plastic pollution in SA comes from open burning (CSIR)

Health Impacts

What Pollution Does to Your Body

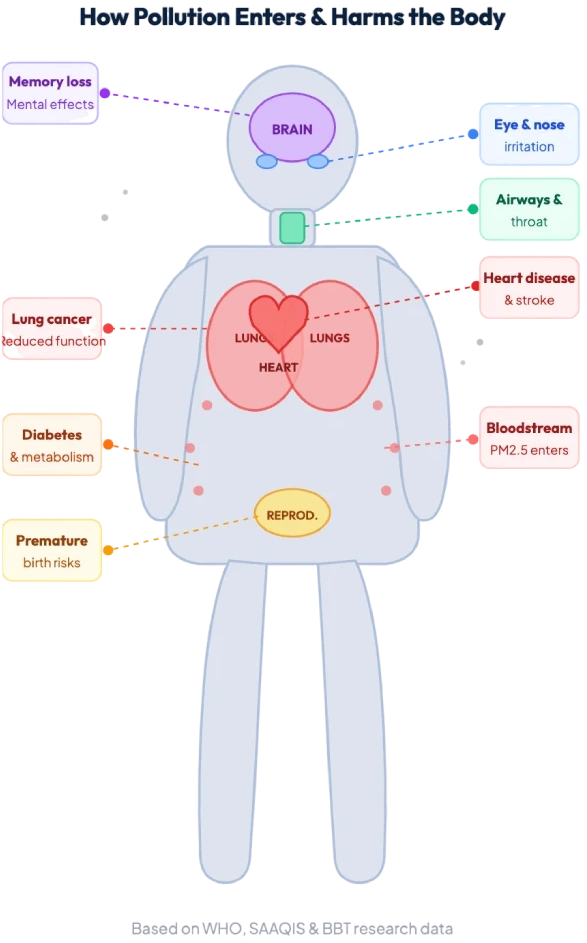
Air pollution is not just about smell or smoke. It enters your body silently – and causes real, lasting damage to your organs and health.
  • Short-Term Effects

During pollution peaks or seasonal attacks

  • Eye, Nose & Throat Irritation
    Stinging, burning, runny nose

    Everyone

  • Coughing & Shortness of Breath
    Wheezing, chest tightness, difficulty breathing

    Children, elderly, asthma patients

  • Asthma Attacks
    Triggered or worsened by PM2.5 and ozone spikes

    Children & adults with respiratory issues

  • Reduced Lung Function
    Lungs cannot work at full capacity

    Outdoor workers, athletes, youth

  • Increased Hospital Visits
    Emergency visits for breathing and heart complications

    People with heart or lung disease

  • Long-Term Effects

Build up over time, even at low exposure levels

  • Stroke & Heart Disease
    PM2.5 and NO₂ damage blood vessels over years

    Caused by: PM2.5, Black Carbon, NO₂

  • Lung Cancer & Bronchitis
    Chronic lung diseases from sustained exposure

    Caused by: PM2.5, VOCs, PAHs

  • Memory Loss & Mental Decline
    PM2.5 and black carbon affect brain function

    Caused by: PM2.5, Black Carbon

  • Premature Birth & Low Birth Weight
    Unborn babies exposed through the mother

    Caused by: PM2.5, CO, VOCs

  • Reduced Life Expectancy
    Chronic exposure to all major pollutants shortens life

    Caused by: All major pollutants

Why This Matters

Air pollution affects our health, our children, and our future. Understanding the data helps us take action
– as individuals and as a city. Clean air is not a luxury. It is something every community deserves.

Common Questions

Frequently Asked Questions

The main sources include vehicles (cars, trucks, taxis), industrial activities (factories, power stations, mines), and the burning of fossil fuels and waste. In South African communities, cooking and heating with wood or coal indoors is also a major source of household air pollution.

Yes — indoor air is often more polluted than outdoor air because of limited ventilation. Everyday sources include dust, smoke from cooking fires, and chemicals from household products. Simple actions like opening windows, avoiding burning things indoors, and switching to cleaner fuels like LPG gas stoves can make a big difference.

Children are especially vulnerable because their airways are smaller and still developing. They also breathe faster than adults, taking in more air relative to their body size — which means more pollutants per breath. Their immune systems are not yet fully developed, making it harder to fight off infections caused or worsened by dirty air.

Green spaces act as natural air filters. Trees absorb harmful pollutants like dust and gases through their leaves and bark. This is why planting trees and supporting clean-up initiatives in your community is one of the most effective long-term actions you can take to improve local air quality.

At home: avoid burning waste, improve ventilation, and switch to cleaner fuels (LPG gas, solar). In your community: report illegal dumping and burning, support recycling and tree-planting. For transport: use public transport, walk, or cycle when possible. Every action counts — especially when communities act together.

Yes. Liquefied Petroleum Gas (LPG) is a much cleaner fuel compared to coal or wood. It produces far less smoke, does not cause the same indoor air pollution, and is available widely — at petrol stations, minimarts, and grocery stores. Switching from solid fuels to LPG for cooking and heating is one of the most impactful steps a household can take for better air quality and better health.

BBT – Breathe Better Together | Johannesburg Air Quality Monitoring

Data sourced from SAAQIS – South African Air Quality Information System

Air quality data helps us understand what we breathe every day. Use this information. Take action. Breathe better.